
サイト内検索
このウォークスルーでは、描写される頻度に基づいてインタフェース要素を色分けして、携帯端末上でのオーバードローをどのように可視化するのかを説明します。
これは以下の作業ができます:
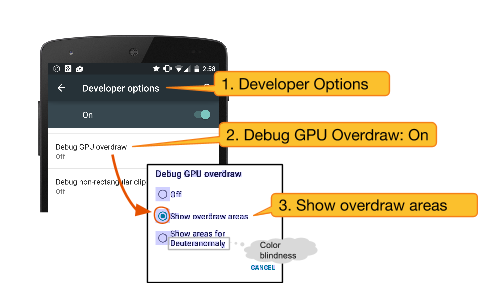
図 1. GPU オーバードローのデバッグを有効にする手順
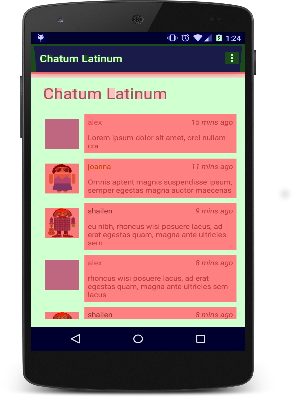
図 2. GPU オーバードローデバッグの出力例。
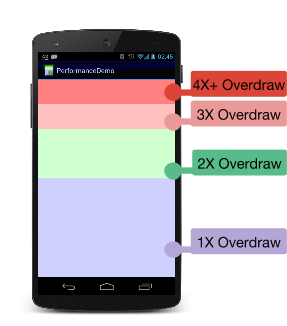
図 3. GPU オーバードローデバッグ出力ごとの色キー。
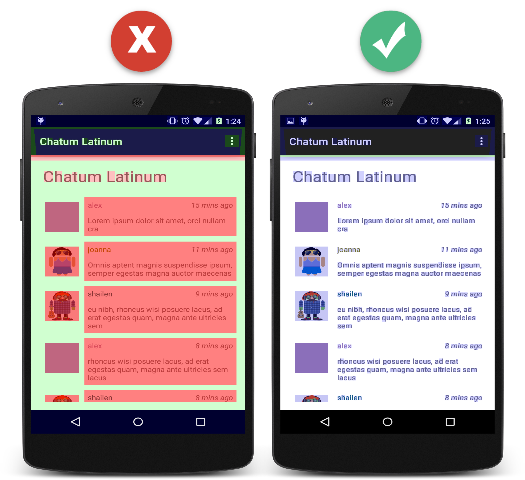
図 4. GPU オーバードローデバッグ出力の望ましい例と望ましくない例。