
サイト内検索
This walkthrough shows the basic usage and workflow for the Heap Viewer tool. Heap Viewer reports in real-time what types of objects your application has allocated, how many, and their sizes on the heap.
What it's good for:
Heap Viewer WalkthroughThis walkthrough shows the basic usage and workflow for the Heap Viewer tool. Heap Viewer reports in real-time what types of objects your application has allocated, how many, and their sizes on the heap. What it's good for:
|
Prerequisites
|
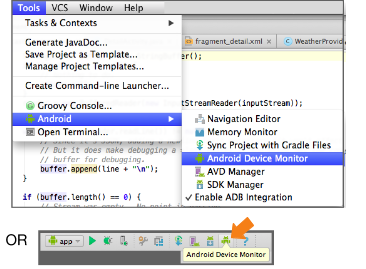
Figure 1. Starting Memory Monitor.
Alternatively, you could start the Memory Monitor in Android Monitor.
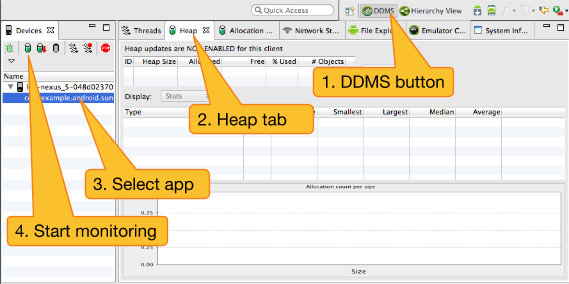
Figure 2. Steps for Using Heap Viewer.
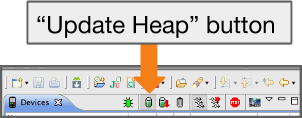
Figure 3. Update Heap button.
Snapshot-yyyy.mm.dd-hh.mm.ss.hprof appears in the
Captures tab.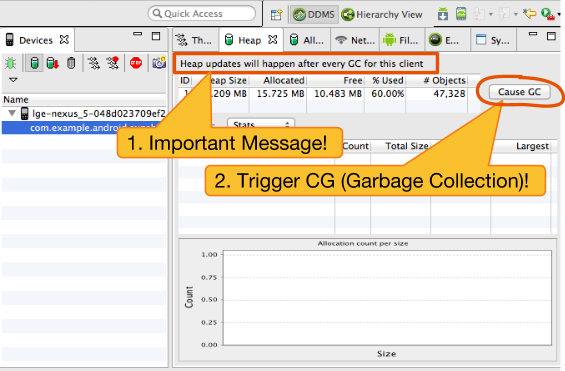
Figure 4. Triggering GC (Garbage Collection).
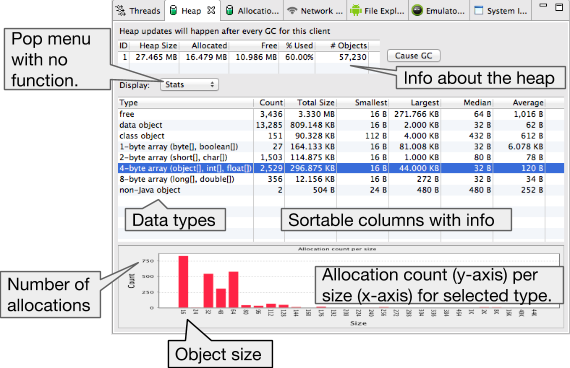
Figure 5. Example Heap Viewer output.
Working with Heap Viewer
|
注意事項
|