This walkthrough shows the basic usage and workflow for the Allocation Tracker tool in Android
Studio. Allocation Tracker records an app's memory allocations and lists all
allocated objects for the profiling cycle with their call stack, size, and allocating code.
What it's good for:
Identifying where many similar object types, from roughly the same call stack, are
allocated and deallocated over a very short period of time.
Finding the places in your code that may contribute to inefficient memory use.
Before using Allocation Tracker, profile your code with the
Memory
Monitor Tool. If you see many garbage collection events in a short amount of time, use
Heap
Viewer to identify candidate object types, and Allocation Tracker to determine where this is
happening in your code.
Allocation Tracker records each memory allocation that your app performs during the profiling
cycle. You tell Allocation Tracker to start recording and it logs allocations
until you tell it to stop.
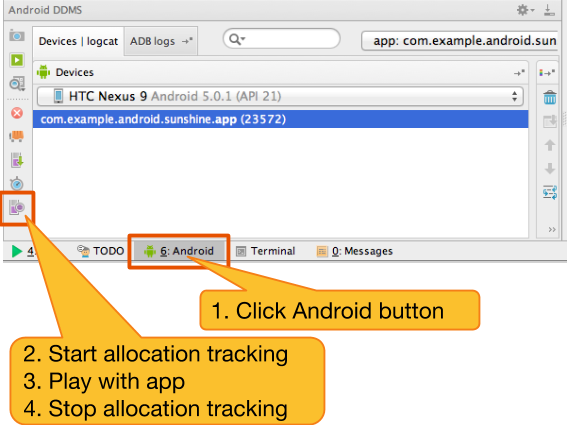
Figure 1. Steps for starting Allocation Tracker in Android DDMS.
Connect your mobile device to your computer.
Open your application in Android Studio, build the source, and run it on your device or
emulator.
Click the Android button at the bottom of your Android Studio window.
If you are using the Android Device Monitor, click the RECORD button
(Start Allocation Tracking tooltip) in the Android DDMS tool bar. If you are using Android
Monitor, click the
icon in the Memory Monitor toolbar.
Interact with your application.
Click the (same) STOP button (Stop Allocation Tracking tooltip).
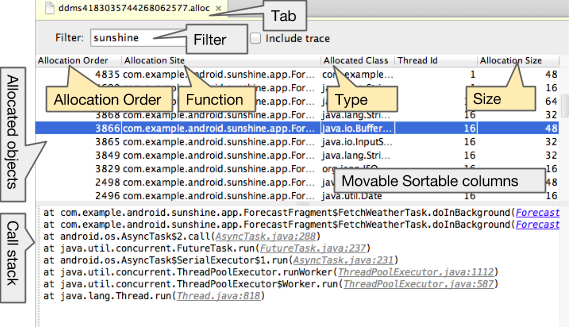
Figure 2. Example of Allocation Tracker output in Android DDMS.
After a few seconds, a pane with your recorded data opens.
Note that allocations are logged on
the device, and the data file is transferred to the host computer, parsed for information, and
displayed.
The pane populates with a table.
Each row represents a memory allocation event.
Each column represents information about the allocation, such as the object type,
the thread, and its size.
The columns are movable, resizable, and sortable.
Use the Filter to show only allocations from your app.
Click on an object to see its full stack trace.
Working with Allocation Tracker
Allocation Tracker records each memory allocation that your app performs during the profiling
cycle. You tell Allocation Tracker to start recording and it logs allocations
until you tell it to stop.
Figure 1. Steps for starting Allocation Tracker in Android DDMS.
Connect your mobile device to your computer.
Open your application in Android Studio, build the source, and run it on your device or
emulator.
Click the Android button at the bottom of your Android Studio window.
If you are using the Android Device Monitor, click the RECORD button
(Start Allocation Tracking tooltip) in the Android DDMS tool bar. If you are using Android
Monitor, click the
icon in the Memory Monitor toolbar.
Interact with your application.
Click the (same) STOP button (Stop Allocation Tracking tooltip).
Figure 2. Example of Allocation Tracker output in Android DDMS.
After a few seconds, a pane with your recorded data opens.
Note that allocations are logged on
the device, and the data file is transferred to the host computer, parsed for information, and
displayed.
The pane populates with a table.
Each row represents a memory allocation event.
Each column represents information about the allocation, such as the object type,
the thread, and its size.
The columns are movable, resizable, and sortable.
Use the Filter to show only allocations from your app.

 (Start Allocation Tracking tooltip) in the Android DDMS tool bar. If you are using Android
Monitor, click the
(Start Allocation Tracking tooltip) in the Android DDMS tool bar. If you are using Android
Monitor, click the