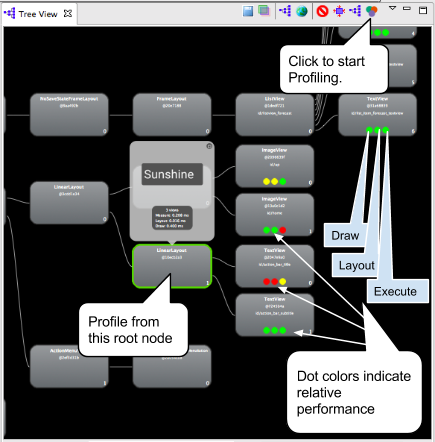
In the Tree View or the Layout View, click on the View node whose
children you want to profile.
To start profiling, click the small button with three circles
at the top of the Tree View.
For large view hierarchies, profiling may take a few seconds.
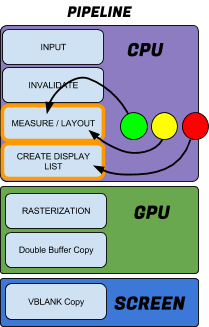
Each view in your subtree gets three dots, which can be green, yellow, or red.
The left dot represents the Draw Process of the rendering pipeline.
The middle dot represents the Layout Phase.
The right dot represents the Execute Phase.
Figure 2. How the colored dots relate to the rendering pipeline.
These dots roughly correspond to the Measure,
Layout, and Draw
phases of the processing pipeline.
The color of the dots indicates the relative performance
of this node in respect to all other profiled nodes.
Green means the view renders faster than at least
half of the other views.
Yellow means the view renders faster than the bottom
half of the other views.
Red means the view is among the slowest
half of views.
Profiling Steps
Figure 1. View hierarchy after profiling.
Start Hierarchy Viewer for your app.
In the Tree View or the Layout View, click on the View node whose
children you want to profile.
To start profiling, click the small button with three circles
at the top of the Tree View.
For large view hierarchies, profiling may take a few seconds.
Each view in your subtree gets three dots, which can be green, yellow, or red.
The left dot represents the Draw Process of the rendering pipeline.
The middle dot represents the Layout Phase.
The right dot represents the Execute Phase.
Figure 2. How the colored dots relate to the rendering pipeline.
These dots roughly correspond to the Measure,
Layout, and Draw
phases of the processing pipeline.
The color of the dots indicates the relative performance
of this node in respect to all other profiled nodes.
Green means the view renders faster than at least
half of the other views.
Yellow means the view renders faster than the bottom
half of the other views.
Red means the view is among the slowest
half of views.
Interpreting Hierarchy Viewer Profiling Results
Hierarchy Viewer measures the relative performance of a
node, so there are always red nodes in a profile, and it
doesn't necessarily mean that view is too slow for the users of
your app.
Hierarchy Viewer software rasterizes your Activity to acquire the timing
information. Rasterization is the process of taking a high-level primitive, such as a
circle or a vector font, and turning it into pixels on the screen. Typically,
rasterization is done by the GPU on your device, but in the case of
software rasterization, rendering is done on the CPU with
ordinary software. This means that the absolute
reported timings are correct relative to each other, but are bloated and vary
depending on the overall and changing CPU workload on your device and PC. Profile
several times to get a feel for the average measurements.
The following are guidelines for interpreting Hierarchy Viewer profiling output.
A red node is a potential problem in any situation where your app has
unexpectedly slow performance. In a relative setting, there is always a
slowest node; make sure it is the node you expect.
The following examples illustrate how to interpret red dots.
Look for red dots in leaf nodes or view groups with only a few children. This
might point to a problem. Your app may not be slow, or it may not be slow on your
device, but you need to be aware of why that dot is red.
Systrace or
Traceview
can give you additional information.
If you have a view group with many children and a red measure phase, take a
look at the children to see how they are performing.
A view with yellow or even red dots might not be performing slowly on the
device. That's where the actual numbers are helpful.
Systrace or
Traceview
can give you additional information.
If the root view of a hierarchy has a red measure phase, red layout phase, and
yellow draw phase, this is somewhat typical, because it's the
parent of all the other views.
If a leaf node in a tree with 20+ views has a red draw phase, this is a
problem. Check your OnDraw method for code that shouldn't be
there.

 at the top of the Tree View.