サイト内検索
Note: The GPU Debugger is Beta in Android Studio 2.2.
After you capture a GPU trace, you can then analyze it in the GPU Debugger. It provides interactive visual tools so you can examine different aspects of app graphics rendering with OpenGL ES 2.0 or 3.1. At the same time, it lets you view the call hierarchy, dynamically change function arguments, view the contents of memory, and more. You can deep dive into each frame, both graphically and programmatically.
For more information about OpenGL ES, see khronos.org. It has a quick reference card that summarizes the commands in a few short pages and can be useful while you're using the GPU Debugger.
To begin using the GPU Debugger, first capture a GPU trace and then display a GPU trace file in the GPU Debugger. Next, follow these general steps, shown in figure 1:
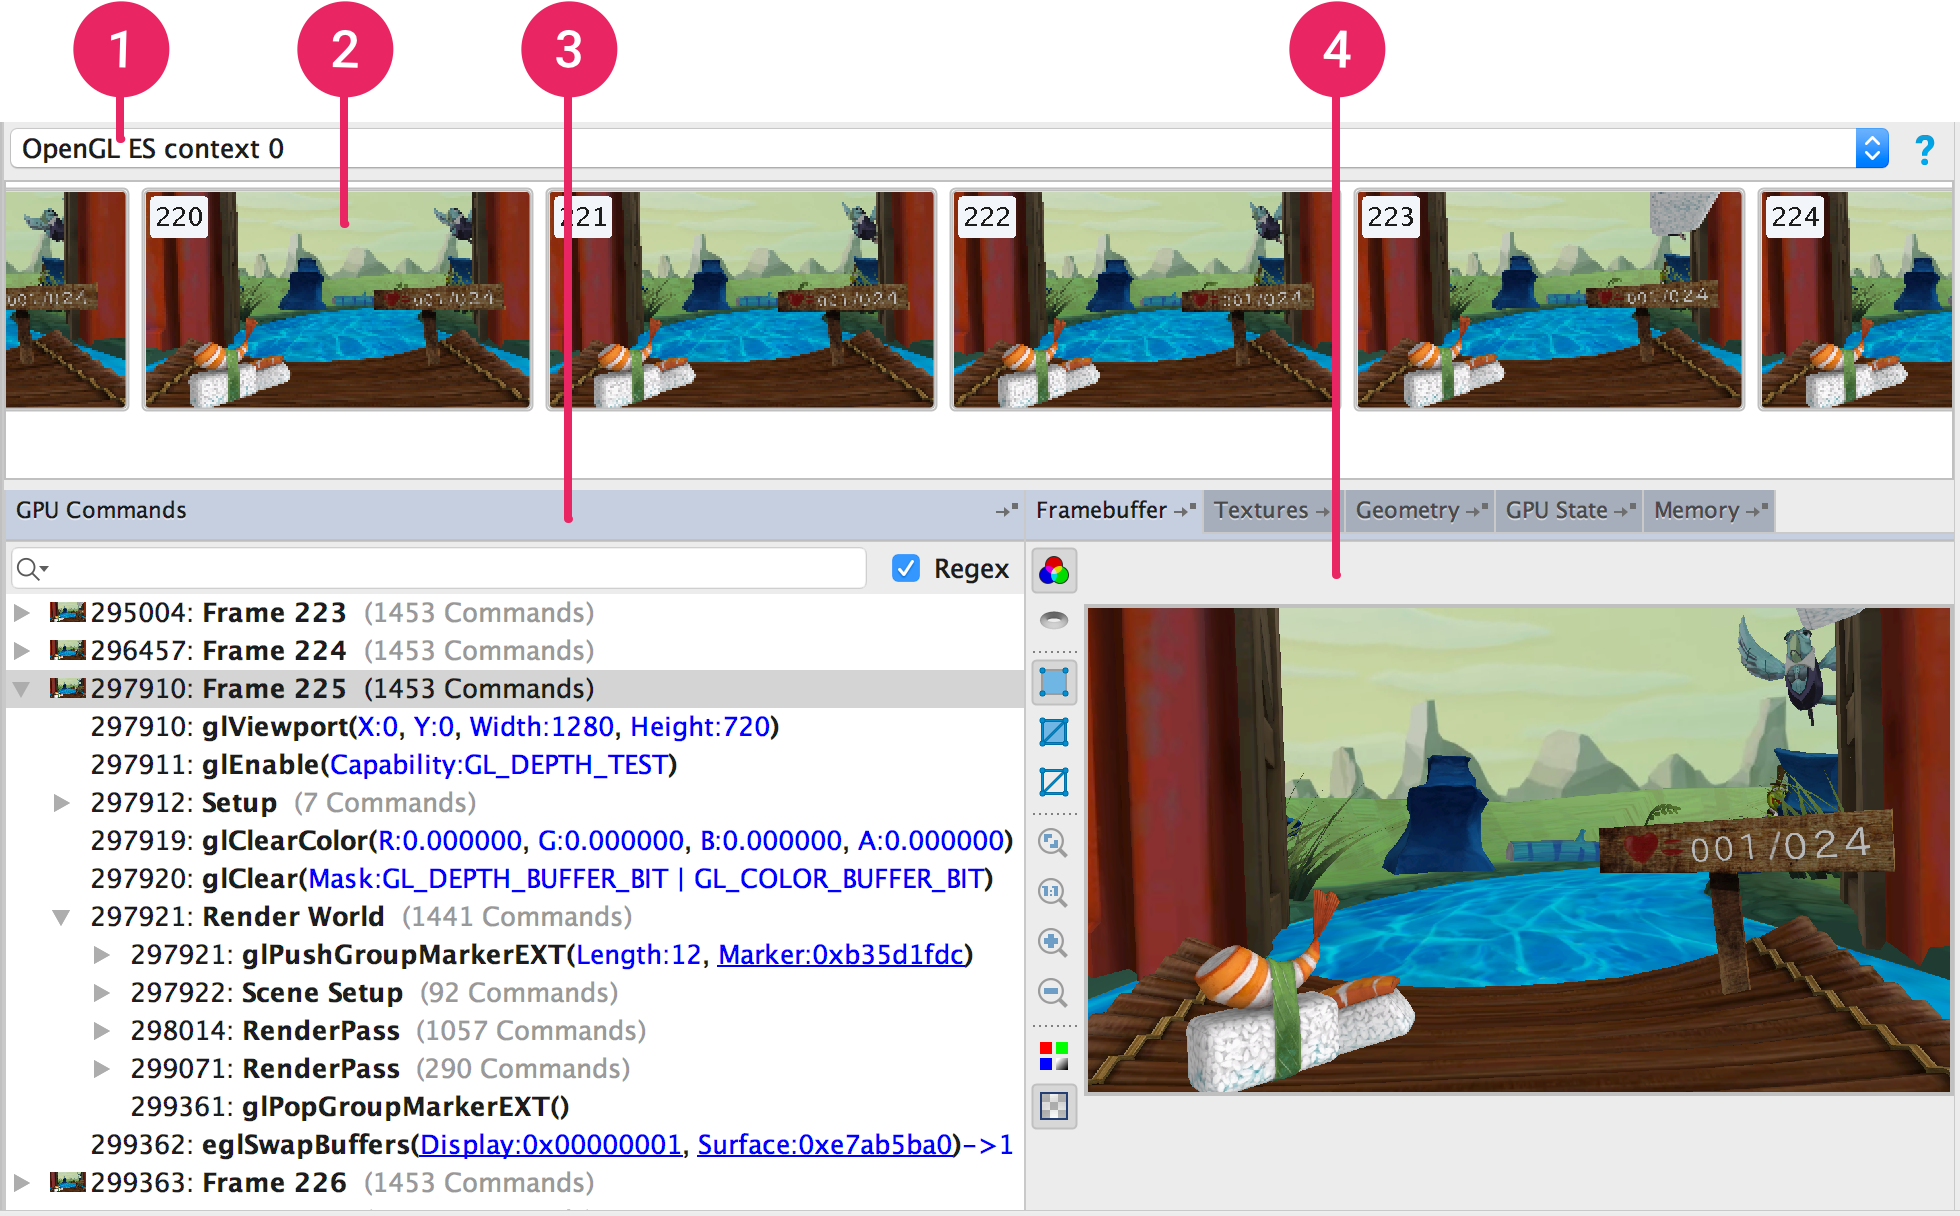
Figure 1. Main areas of the GPU Debugger.
Analyzing your app starts with choosing a rendering context. A context is required to execute OpenGL ES commands. It gathers the states needed for rendering an image and has information about relevant buffers, shaders, textures, and so on. Many game apps have just one context. More advanced apps may use more than a single context.
If your app has more than one context, it's easier to use the tool if you choose one context instead of all of them. When you select one context, the calls are grouped by frame in the GPU Commands pane. If you select all contexts, the calls are instead grouped by context.
Frame thumbnails appear beneath the context menu in a timeline. They correspond to the list of frames in the GPU Commands pane. Both areas always show the same selected frame. When you select a frame in the timeline, that same frame is selected in GPU Commands pane; when you select a frame in the GPU Commands pane, the same frame is selected in the timeline.
The GPU Commands pane displays OpenGL ES calls for each frame. Expand the tree to examine the calls.
A frame ends when the app calls the eglSwapBuffers() function,
which is used by double-buffering apps. If your app doesn't support
double-buffering, however, you might end up with a single frame after a trace.
The frame thumbnails show the onscreen display after the buffers are swapped.
After you select a frame, you can explore it further using the various tabs:
You can rearrange the tabs to best suit your development process. After you rearrange the panes, the GPU Debugger remembers the configuration whenever you open a trace file afterward.
Here are some ways to rearrange the tabs:
 . To make it reappear, click Restore View
 on the far right and above the row of tabs.
Figure 2 shows one possible configuration, where the graphical windows are in the middle pane, and the state and memory details are in the right pane.
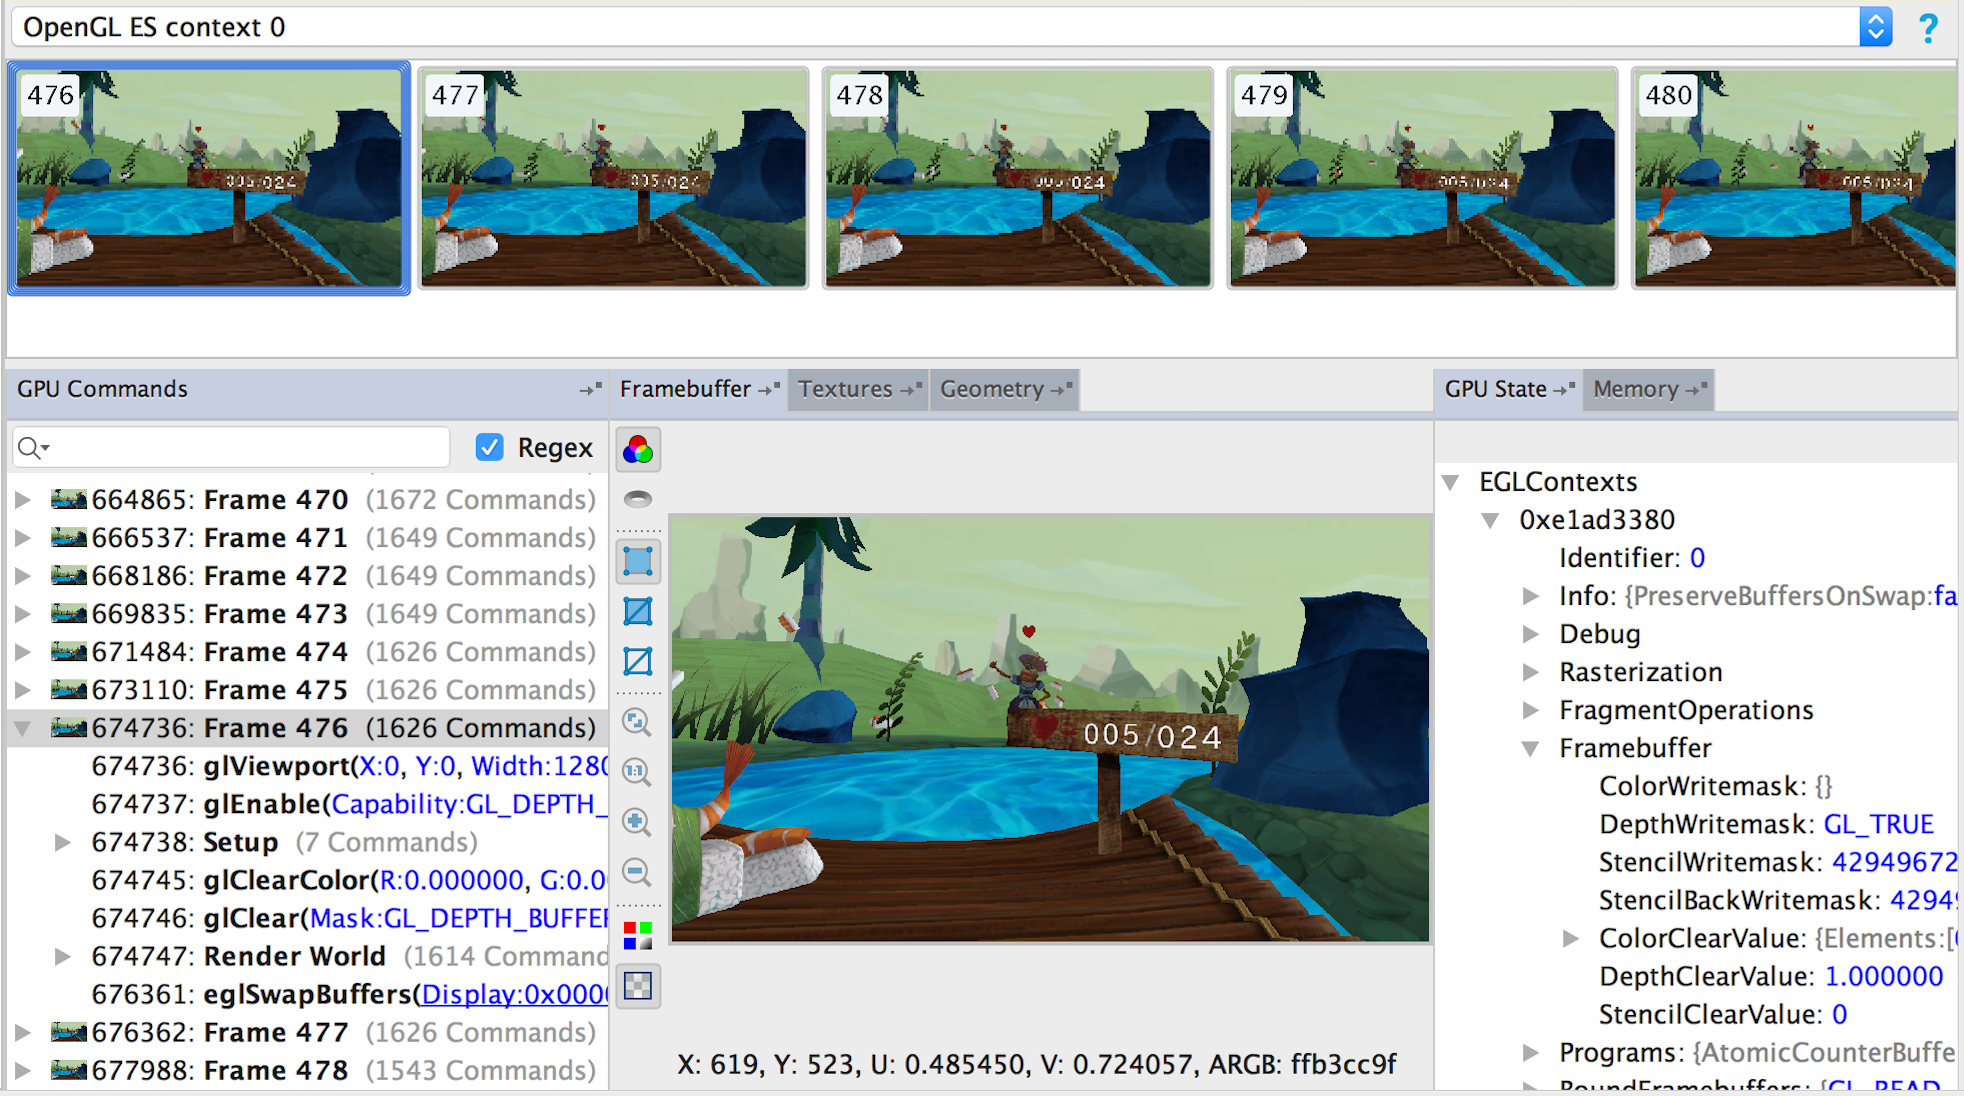
Figure 2. Reorganized GPU Monitor tabs.
When you display one context, the GPU Commands pane displays OpenGL ES calls grouped by frame. It also groups draw commands under a Draw node. You can create additional groupings by adding debug markers to your code, as described in the following section.
When you select a call or frame thumbnail, the GPU Debugger updates all tabs to the same state: after the call was executed. For example, if you click a memory address or pointer, the values appear in the Memory pane.
You can perform the following operations in the GPU Commands pane:
 or double-click the item.
 at the top of the pane, and then press Return. If you want to
use a regular expression search pattern, select Regex. To find
the next occurrence, select the search field and press Return
again.
at the top of the pane, and then press Return. If you want to
use a regular expression search pattern, select Regex. To find
the next occurrence, select the search field and press Return
again.
Depending on your app, the GPU Command pane can contain a very long list of OpenGL ES calls within one frame. For better navigation and readability, you can define debug markers that group calls together under a heading in the tree.
For example, figure 3 shows several debug markers:
Considering that Frame 225 contains 1453 commands, you can see that the debug markers are quite helpful.
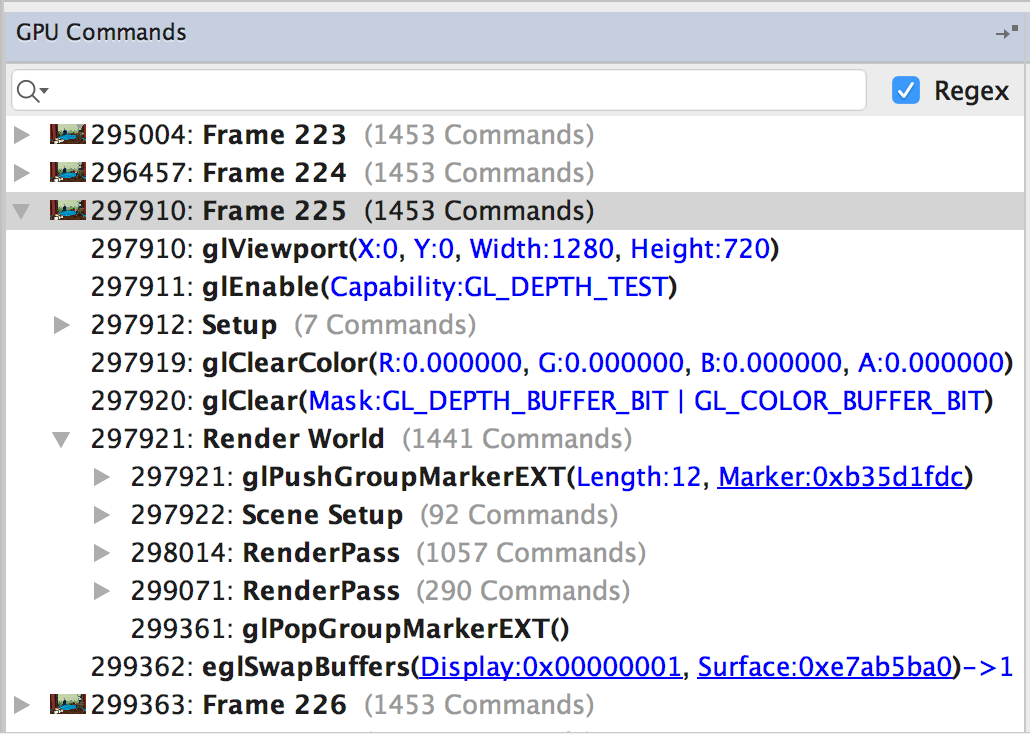
Figure 3. Debug markers in the GPU Commands pane.
As shown in the figure, the glPushGroupMarkerEXT() and
glPopGroupMarkerEXT()functions add and then remove the debug marker
string of Render World. For more information about adding debug
markers to your code, see EXT_debug_marker
on the khronos.org website.
The GPU Debugger automatically adds a Draw grouping if it's completely within or outside of a user-defined debug marker group. However, if part of it is both within and outside of a user-defined debug marker group, the Draw grouping won't appear.
The Framebuffer pane shows the contents of the currently bound default framebuffer. Depending on the item you select in the GPU Commands pane, it can show onscreen or offscreen framebuffers.
When you select a command in the GPU Commands pane, the
Framebuffer pane displays the contents of the framebuffer after
that call finishes. If you select a Draw grouping or debug
marker, it displays the framebuffer after the last call in the group finishes.
However, if you select a Frame grouping, the
Framebuffer pane displays the framebuffer before the
eglSwapBuffers() function finishes — ahead of the buffer swap.
In essence, you can start by selecting the first call within a frame, and then click each successive call to watch the framebuffer components draw one-by-one until the end of the frame. These framebuffer displays, for both onscreen and offscreen graphics, help you to locate the source of any rendering errors.
Figure 4 shows an example of a framebuffer display.
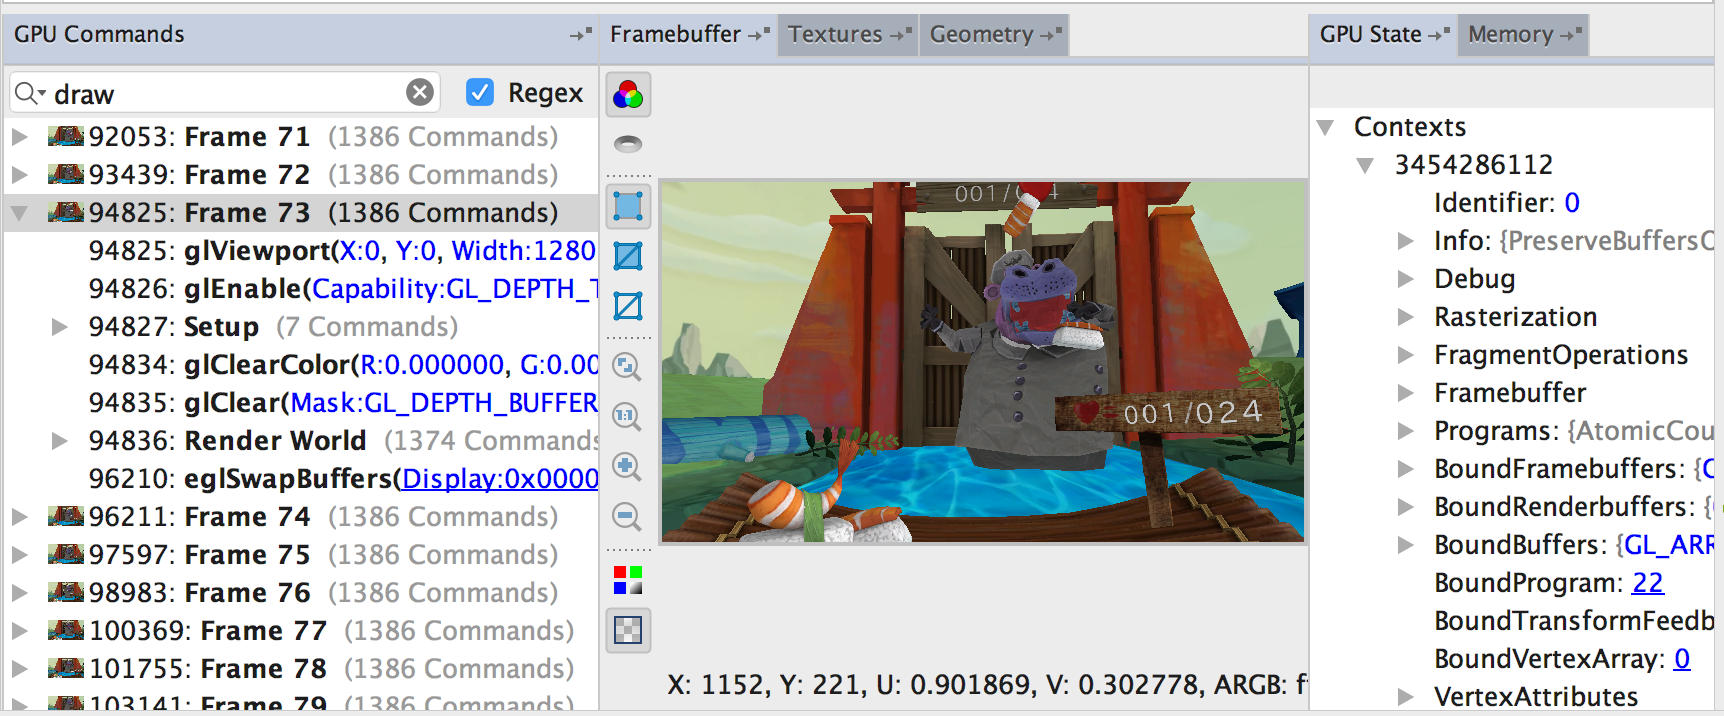
Figure 4. A completely drawn framebuffer.
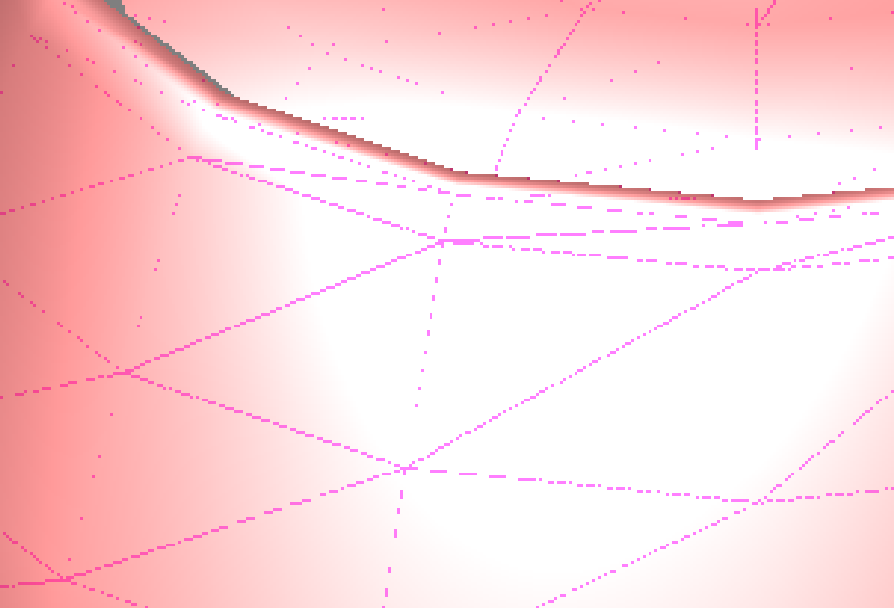
If the framebuffer contains undefined data, you'll see diagonal bright green lines, as shown in figure 5.
![]()
Figure 5. A framebuffer containing nothing to display.
To examine a framebuffer in the Framebuffer pane, follow these general steps:
The drawn framebuffer appears.
Move your mouse over the framebuffer to view the x, y, u, and v pixel coordinates, and the ARGB pixel color value, for the pixel directly under the cursor. The values appear at the bottom of the pane.
The following table describes the operations you can perform with the toolbar buttons.
| Button | Description | Example | Color Buffer
|
Select this button to display the color buffer, as opposed to the depth buffer. |
|
|---|---|---|
Depth Buffer
|
Select this button to display the depth buffer, as opposed to the color buffer. When the depth buffer is enabled, OpenGL ES performs a depth test for each fragment, and it draws only those fragments that will be seen because they're closer. |

|
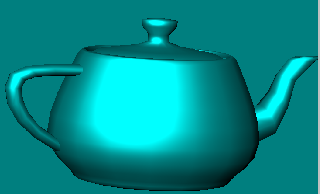
Shaded
|
Select this button to display shaded polygons. |
|
Shaded + Wireframe
|
Select this button to display shaded polygons overlaid with the last draw call represented as a wireframe. The wireframe is violet and highlights what was drawn last. Zoom in to see the details. |
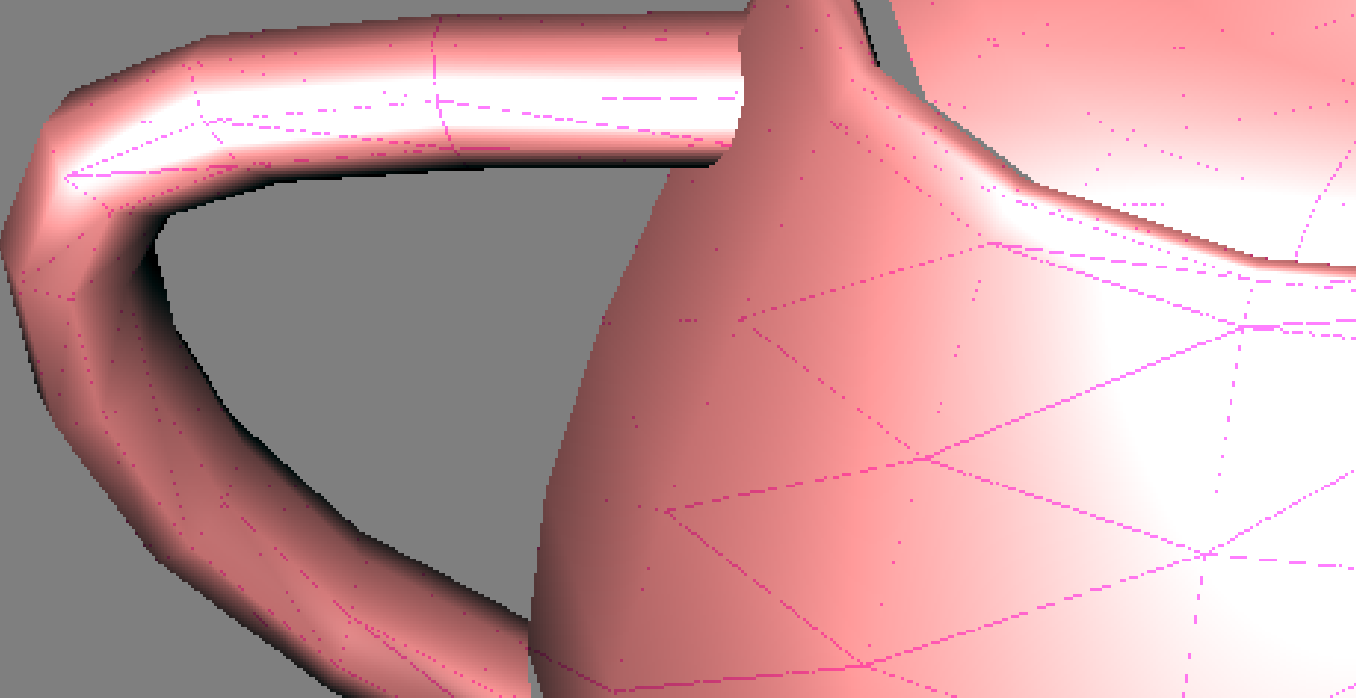
|
Wireframe
|
Select the button to show a wireframe view of the framebuffer. It shows the structure, vertices, number of triangles, and more. You can see through objects and view hidden items to help with debugging them. |
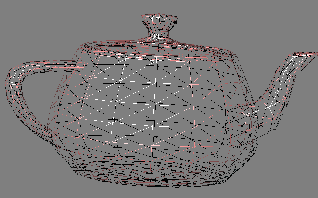
|
Zoom to Fit
|
Click the button to adjust the graphic to fit completely within the Framebuffer pane. Right-clicking the image is another way to Zoom to Fit. | |
Actual Size
|
Click the button to show the image at no scale, where one device pixel is equivalent to one screen pixel. | |
Zoom In
|
Click the button to zoom in. You can also use your mouse wheel, or two-finger swipes on a touchpad, to scroll in and out. You can drag the image with your cursor. | |
Zoom Out
|
Click the button to zoom out. You can also use your mouse wheel, or two-finger swipes on a touchpad, to scroll in and out. | |
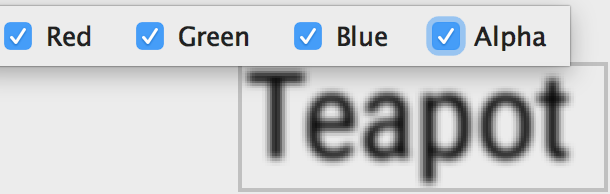
Color Channels
|
Click the button and then select the color channels to render or deselect color channels so they aren't rendered. The options are Red, Green, Blue, and Alpha (transparency). |
|
Show Checkerboard
|
Select the button to enable the checkerboard background to indicate transparency. |
The Textures pane lets you view the textures created at or before your position in the trace. Textures are images that you can apply to your shape surfaces to provide detail. 2D textures are made of small blocks of data, called texels.
Figure 6 shows texture images that are placed on sushi shapes.
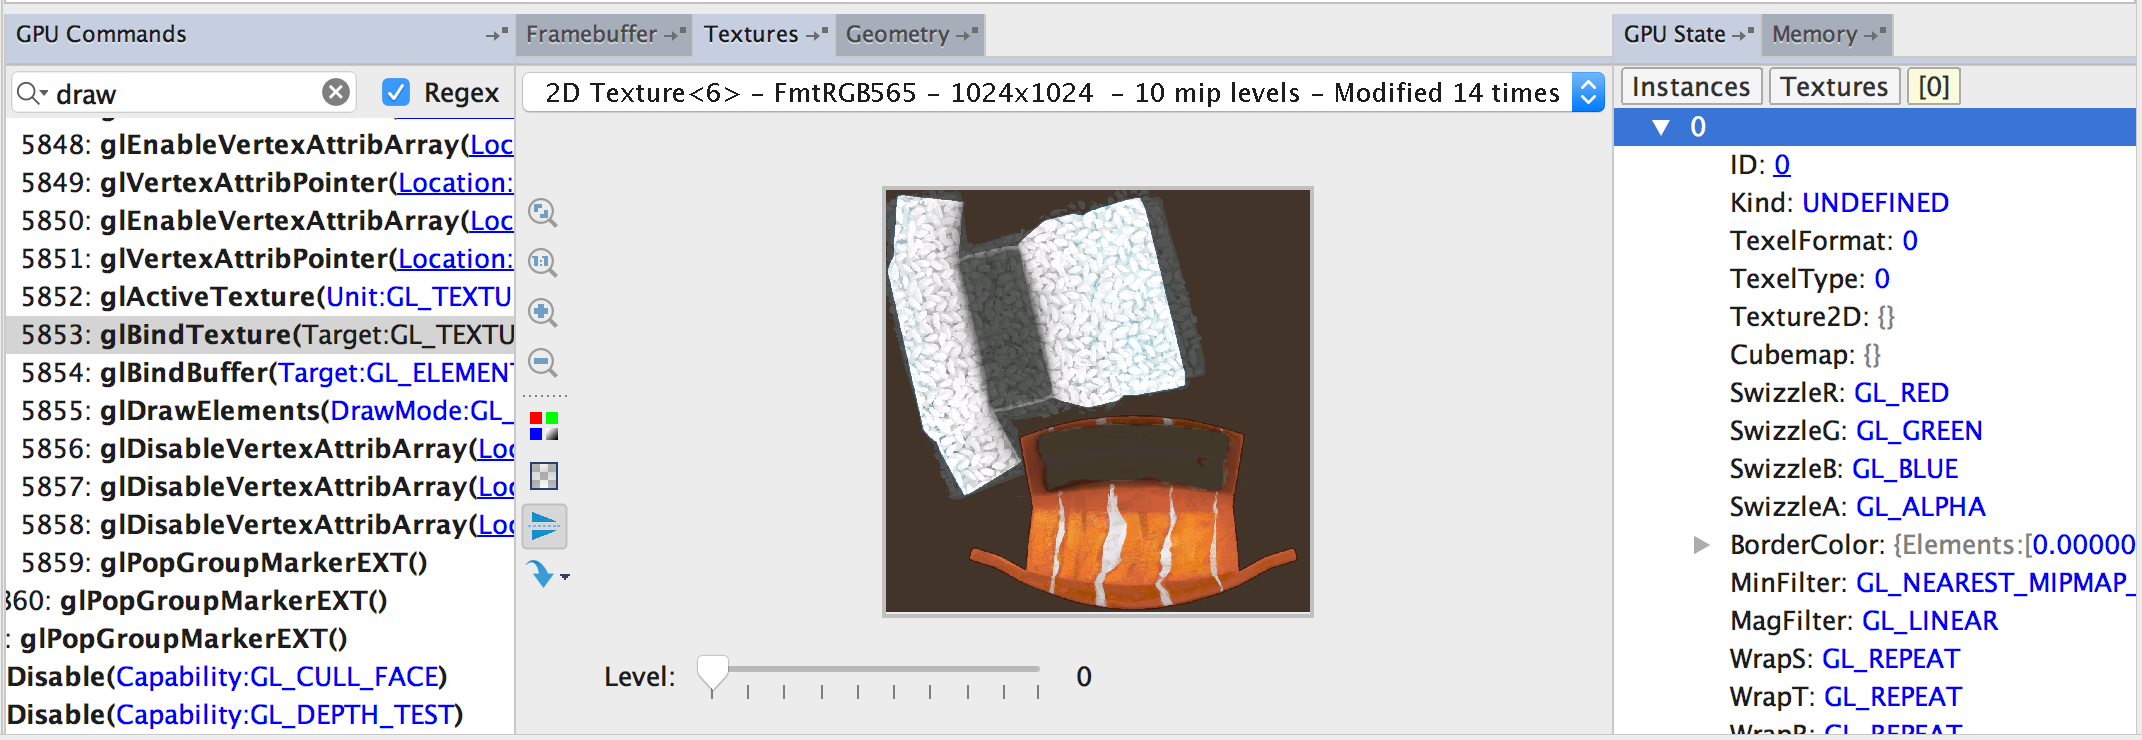
Figure 6. Textures pane.
To examine textures in the Textures pane, follow these general steps:
The texture appears under the menu.
The menu lists textures created at or before your position in the trace; the textures aren't necessarily filled with data yet, however.
Each level shows different texel densities of the same texture image. By looking at the different densities, you can determine if you need to adjust an image so the display at that density is optimal.
If a slider doesn't appear, then the texture doesn't have multiple levels (it's not a mipmap).
Move your mouse over the texture to view the x, y, u, and v coordinates, and the ARGB value, for the texel directly under the cursor. The values appear at the bottom of the pane. The x and y values represent screen space, and the u and v values represent texel space.
The following table describes the operations you can perform with the toolbar buttons.
| Button | Description | Example |
|---|---|---|
| Zoom to Fit
|
Click the button to adjust the graphic to fit completely within the Textures pane. Right-clicking the image is another way to Zoom to Fit. | |
| Actual Size
|
Click the button to show the image at no scale, where one device pixel is equivalent to one screen texel. | |
| Zoom In
|
Click the button to zoom in. You can also use your mouse wheel, or two-finger swipes on a touchpad, to scroll in and out. You can drag the image with your cursor. | |
| Zoom Out
|
Click the button to zoom out. You can also use your mouse wheel, or two-finger swipes on a touchpad, to scroll in and out. | |
| Color Channels
|
Click the button and then select the color channels to render or deselect color channels so they aren't rendered. The options are Red, Green, Blue, and Alpha (transparency). |
|
| Show Checkerboard
|
Select the button to enable the checkerboard background to indicate transparency. |
|
Flip Vertically
|
By default, the Textures pane shows the texture the way OpenGL ES sees it. When you click the button, the image flips across a horizontal line. A selected button means that the image appears differently than the default (it's flipped). |
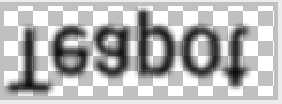
|
Accesses/
Modifications
|
Select this button to view a list of all calls that updated the texture to this point. Select a call to view the texture after the call completes. The selected frame thumbnail and the GPU Commands pane update accordingly. |
|
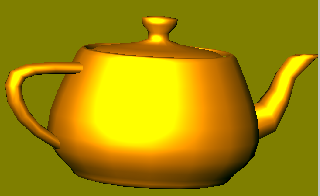
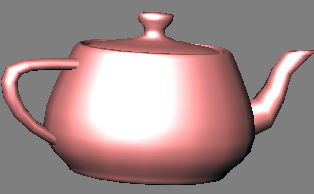
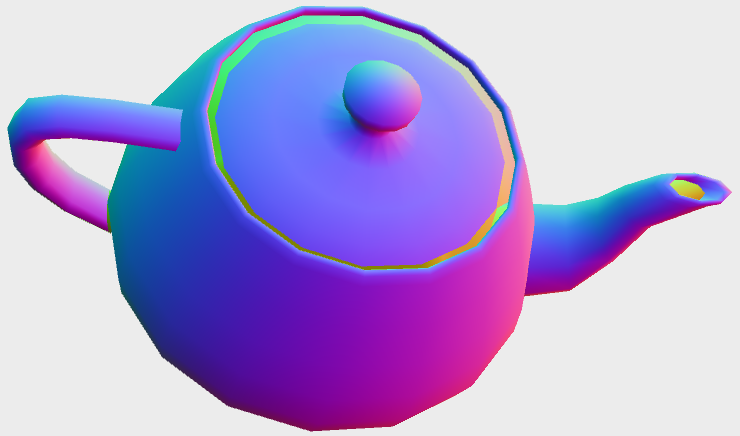
The Geometry pane renders an image in 3D. You can use your
mouse or touchpad to rotate the rendering, and zoom in and out. To display an
image in the Geometry pane, you must select a draw call in the
GPU Commands pane. For example, in figure 7, the
Geometry pane displays the image rendered after the selected
glDrawElements() call completes.
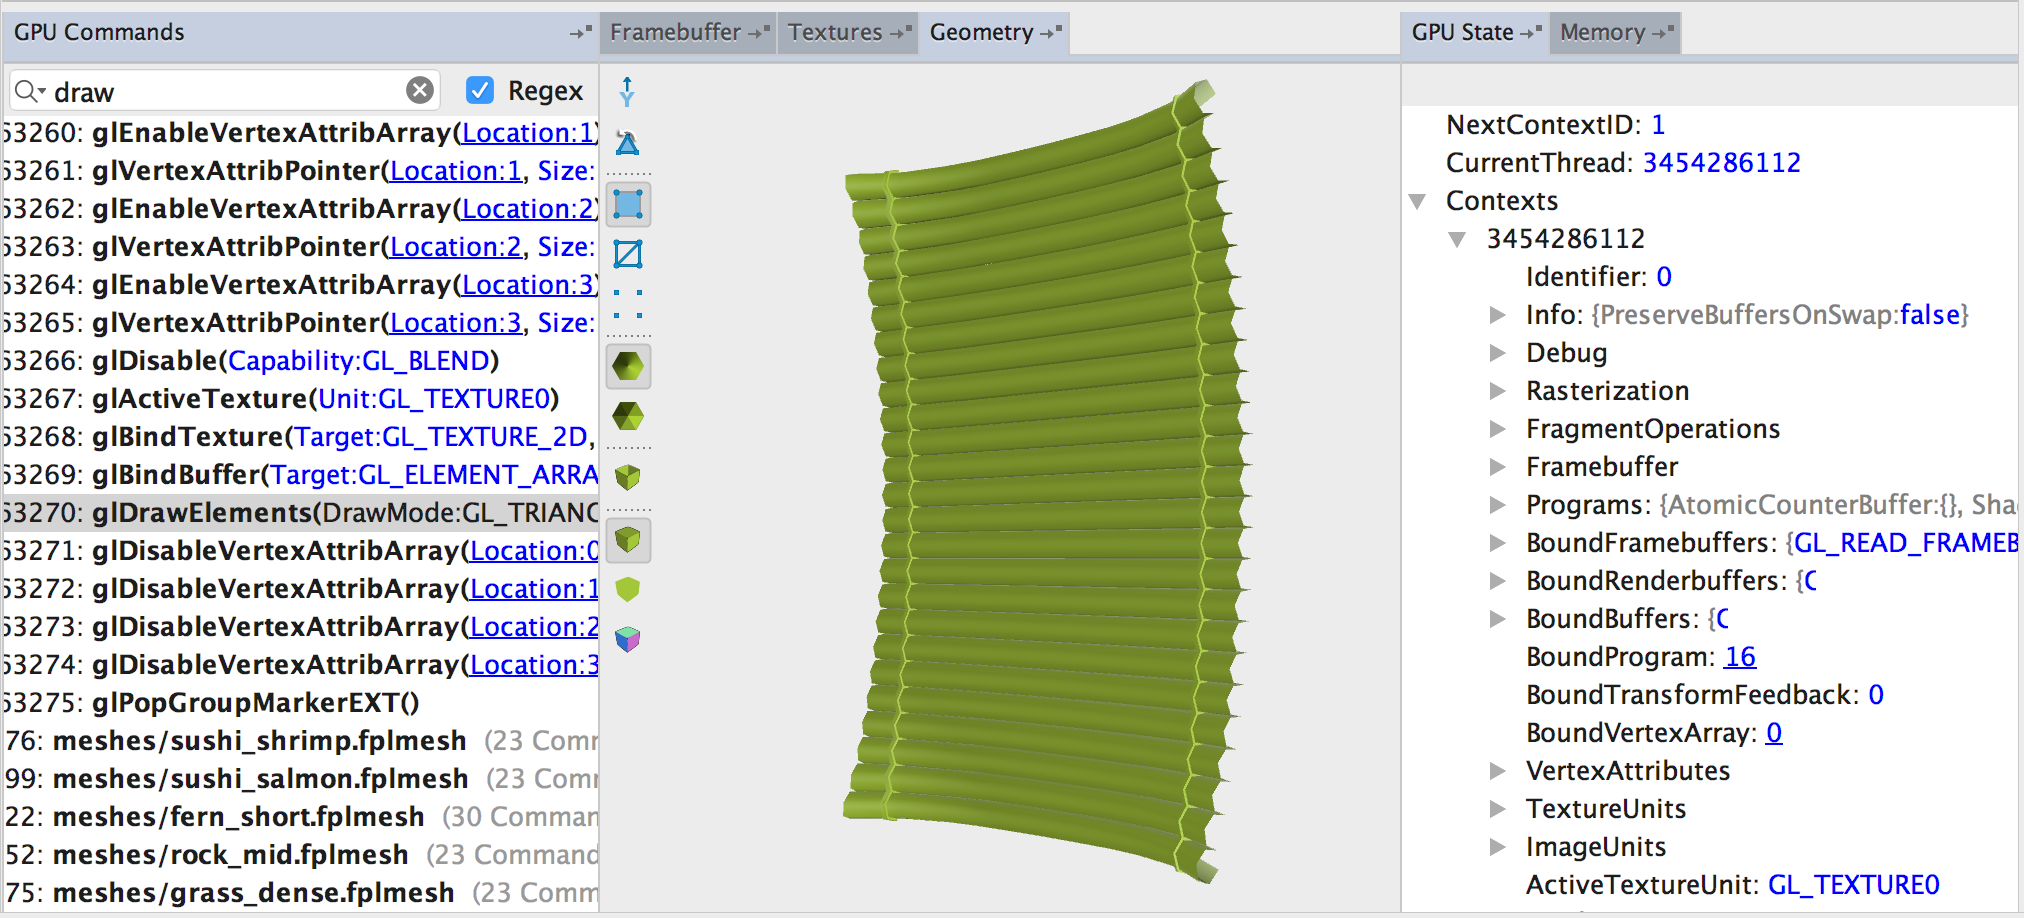
Figure 7. Geometry pane.
To examine an image in the Geometry pane, follow these general steps:
The image appears in the Geometry pane.
Drag your cursor over the image to view all sides of the image, including front and back. You can also use your mouse wheel, or two-finger swipes on a touchpad, to zoom in and out. You can zoom in and look at pixels to determine why something is rendering badly.
The following table describes the operations you can perform with the toolbar buttons.
| Button | Description | Example |
|---|---|---|
Y-Up
|
Click the button to toggle between y axis up and z axis up. In OpenGL ES, the default is the y axis pointing up, the x axis horizontal, and the z axis as depth. |
|
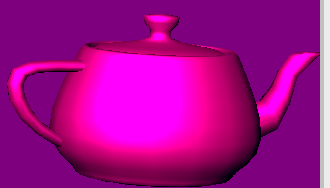
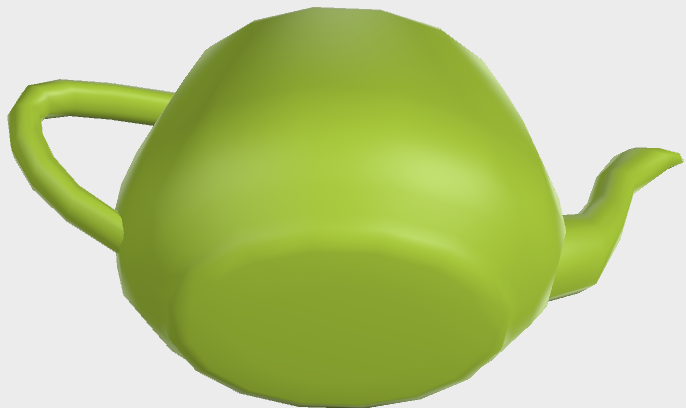
Triangle Winding
|
Toggle between counterclockwise and clockwise triangle winding to view front- versus back-facing triangles. Dark green represents the back face, while a lighter green represents the front face. If you set the button to the winding convention that you use in your code, and the image appears dark, then you know there's a problem with your geometry. |
|
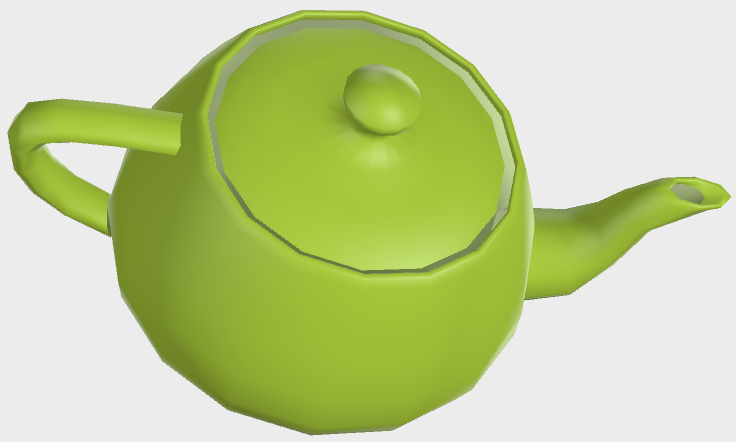
| Shaded
|
Show the geometry rendered as shaded polygons. |
|
| Wireframe
|
Show the geometry rendered as a wireframe. |
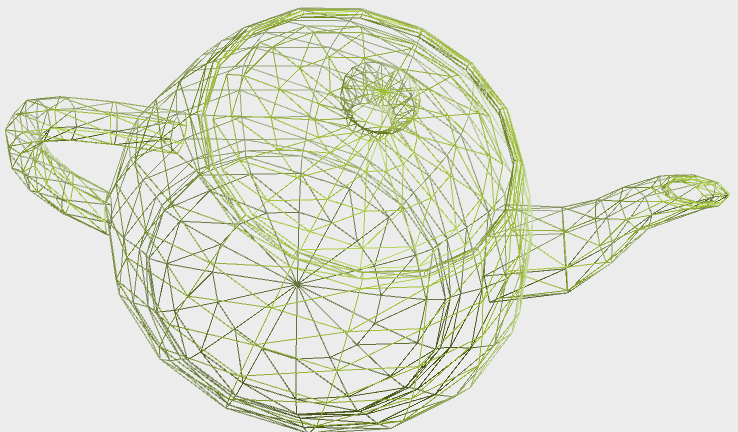
|
Point Cloud
|
Show the geometry rendered as vertex data points. |
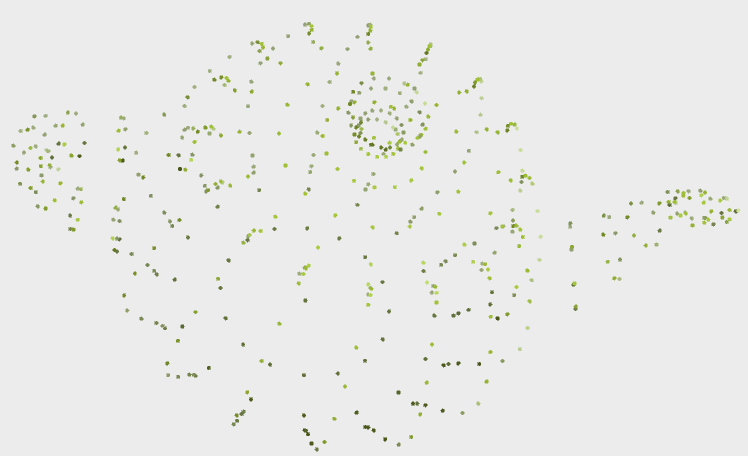
|
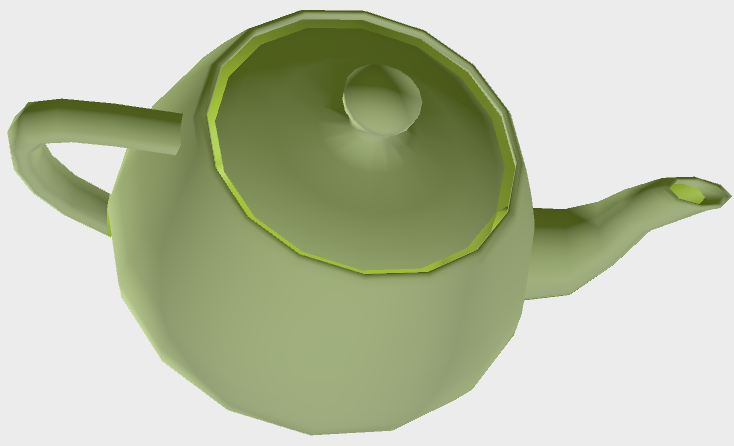
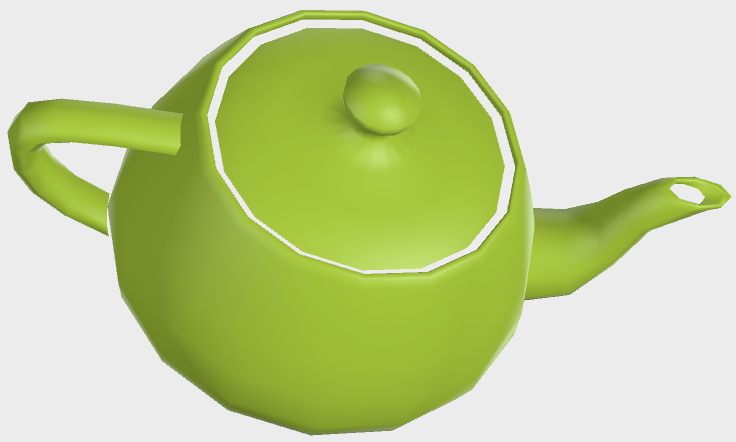
Original
|
Select this button to display smooth normals as specified in your code. The button is unavailable if you haven't authored normals in your mesh. |
|
Faceted
|
Select this button to see the lit geometry without using smooth normals. It renders the geometry as if each polygon were flat instead of smoothed, using computed face normals. |
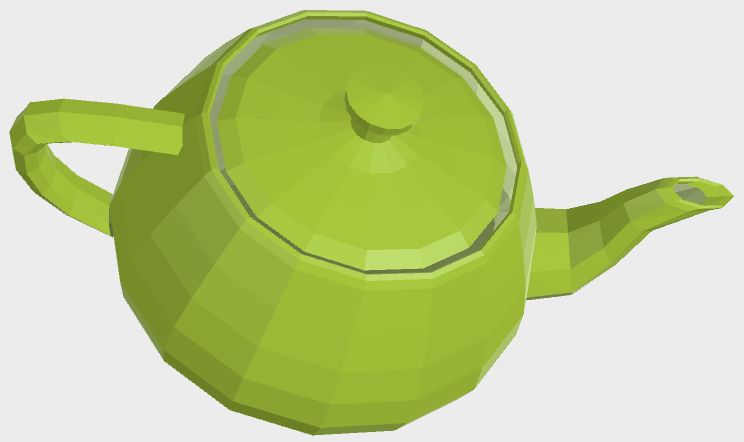
|
Backface Culling disabled
 enabled
|
Click this button to toggle backface culling, which determines whether backward-facing polygons are rendered. Backface culling detects which polygons aren't visible to the viewer, so they aren't rendered and improve rendering efficiency. To troubleshoot problems with rendering backward-facing triangles, first make sure the winding is set correctly. If the geometry appears correct, then check backface culling. |
|
Lit
|
Select this button to show lit shading. |
|
Flat
|
Select this button to show flat shading. It displays a silhouette of the mesh. |

|
Normals
|
Select this button to assist with debugging normals. Red indicates a positive x axis value, green a positive y axis value, and blue a positive z axis value. |
|
OpenGL ES is basically a large state machine. Use the GPU State pane to view the driver state at the point of the trace that's selected in the GPU Commands pane. For example, you can see which OpenGL ES capabilities are enabled. Figure 2, and figures 4 through 7, show examples of the GPU State pane display.
For long lists of capabilities in a hierarchy, the GPU State pane can display breadcrumb subtabs for easier navigation, as shown in figure 8. Contexts is at the top of the hierarchy, and 24 is at the bottom.
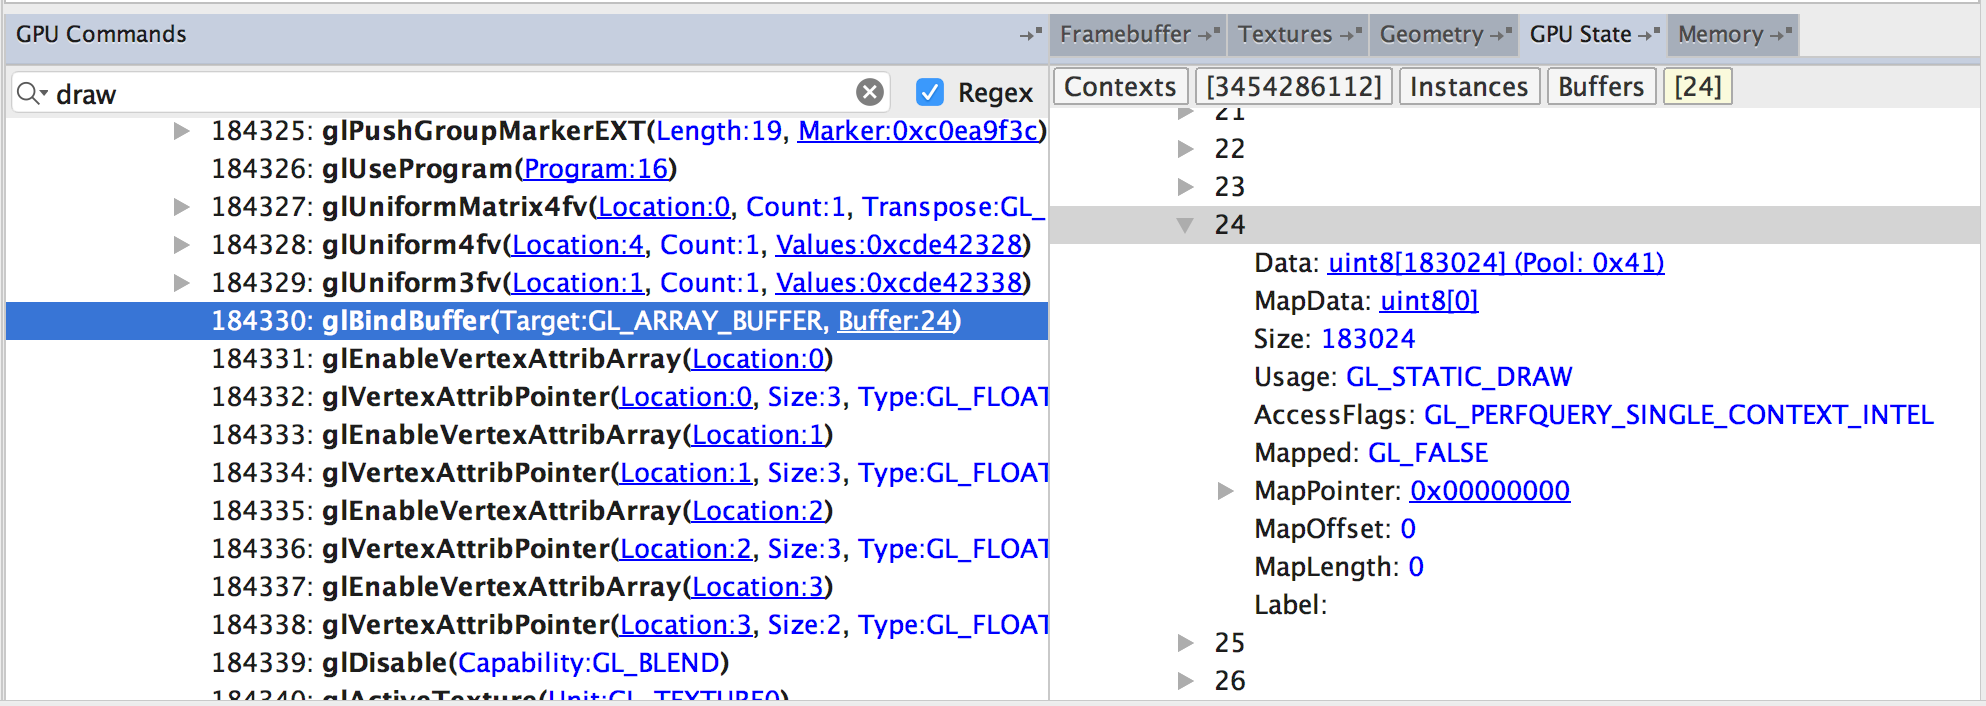
Figure 8. GPU State pane with hierarchic breadcrumb subtabs for easier navigation.
Figure 8 illustrates how easy it is to view number-identified argument values. Simply click the argument, such as Buffer: 24, in the GPU Commands pane, and then view it in the GPU State pane.
You can copy values from the display into a text file.
To examine the state in the GPU State pane, follow these general steps:
The state values appear in the GPU State pane.
The Memory pane lets you view the values stored in memory for the selected call. You can display the memory as a certain data type, and copy values from the display into a text file. You can't edit memory values in the GPU Debugger. Figures 9 and 10 show values as displayed in the Memory pane.
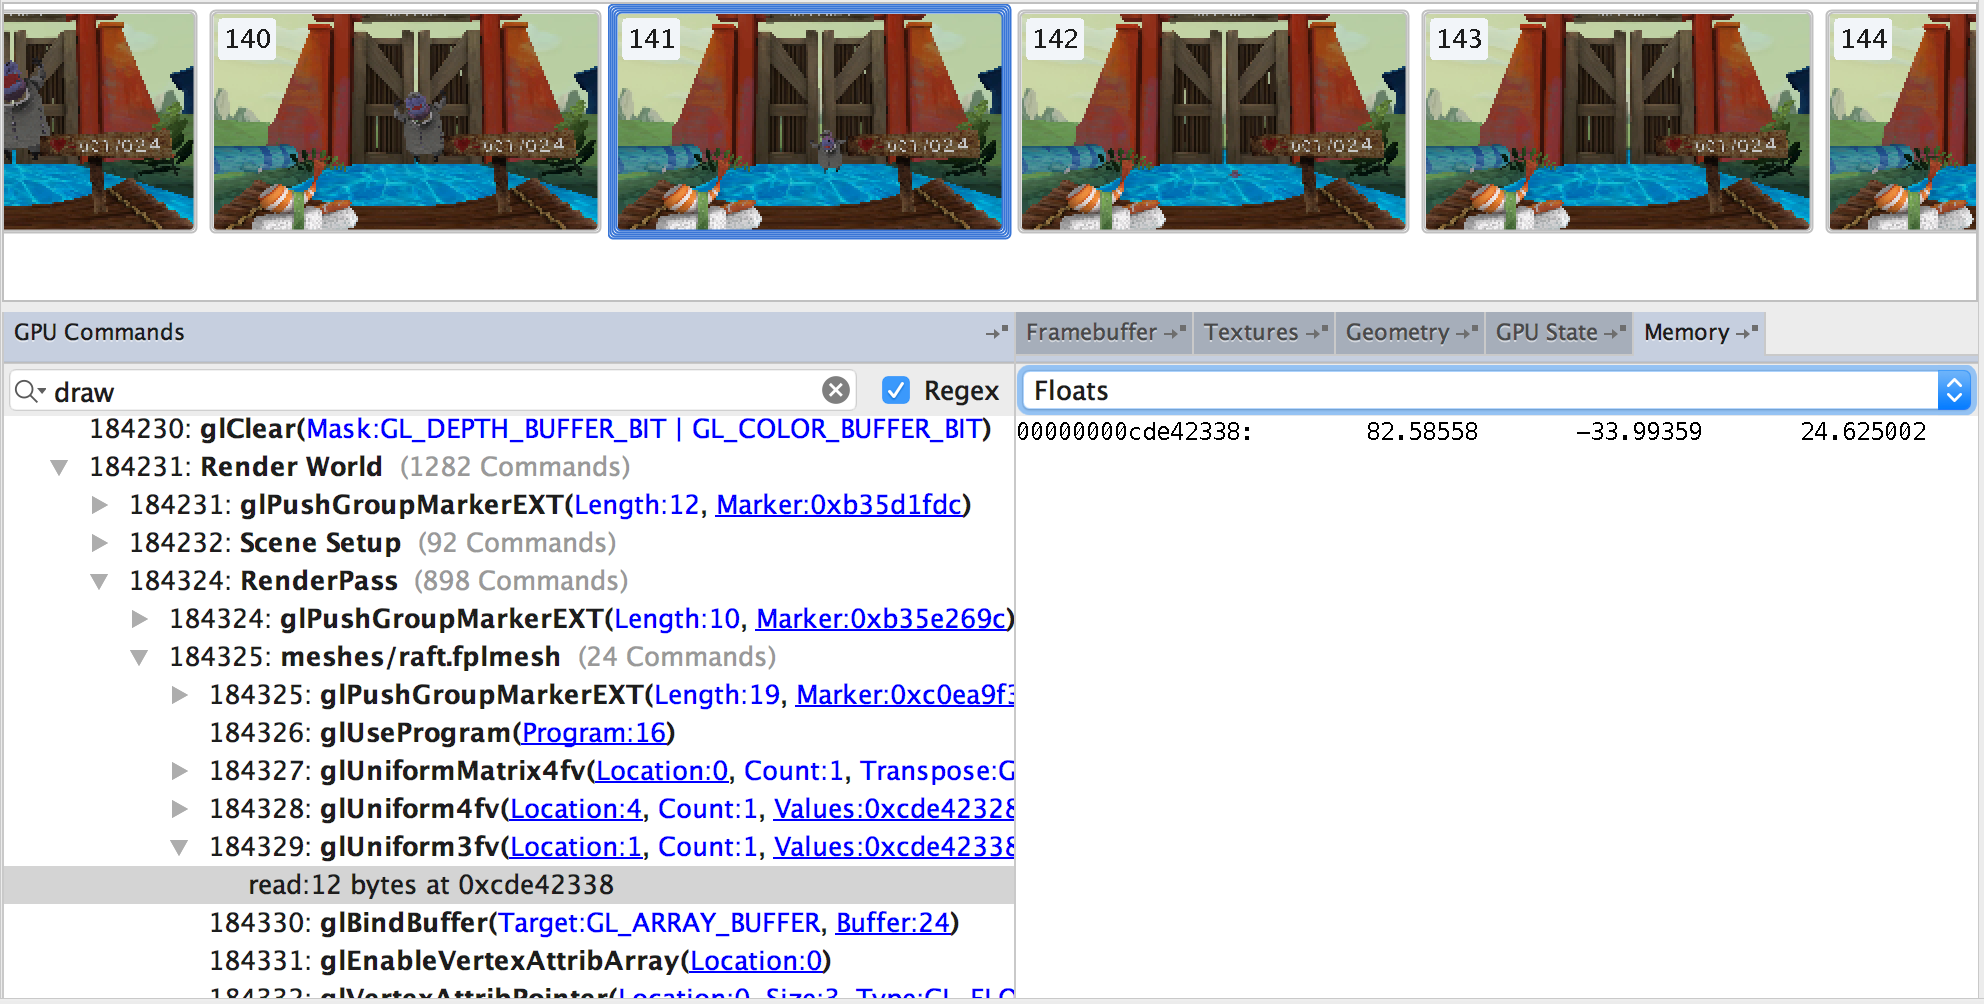
Figure 9. read: line displayed in the Memory pane.
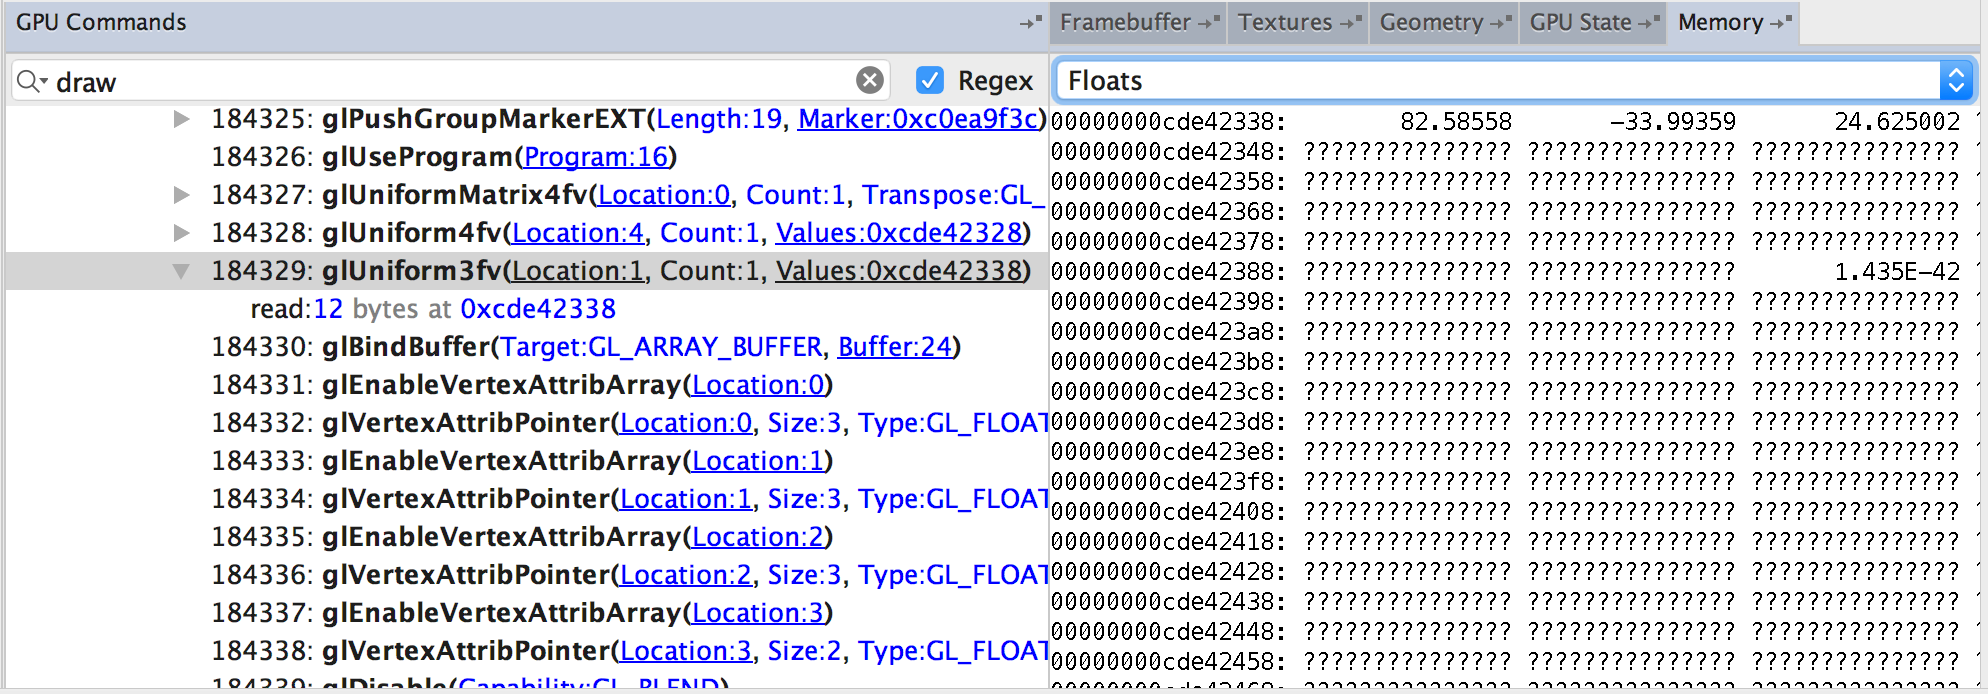
Figure 10. Values: argument displayed in the Memory pane.
In figure 10, the question marks (?) indicate areas of memory that weren't captured, so the GPU Debugger doesn't know what it contains.
To examine memory values in the Memory pane, follow these general steps:
The memory values appear in the Memory pane.
You can copy information from the GPU Commands, GPU State, and Memory panes.
To copy values from the display, do the following:
The following is an example of text copied from the GPU Commands pane:
Stream
└── Frame 360       (498733 - 500114)
    ├── 498733:     glViewport(X:0, Y:0, Width:1280, Height:720)
    ├── 498734:     glEnable(Capability:GL_DEPTH_TEST)
    └── Setup       (498735 - 498741)
        ├── 498735: glPushGroupMarkerEXT(Length:5, Marker:0xb35e269c)
        ├── 498736: glBindFramebuffer(Target:GL_FRAMEBUFFER, Framebuffer:0)
        ├── 498737: glViewport(X:0, Y:0, Width:1280, Height:720)
        ├── 498738: glClear(Mask:GL_DEPTH_BUFFER_BIT)
        ├── 498739: glEnable(Capability:GL_CULL_FACE)
        ├── 498740: glCullFace(Mode:GL_BACK)
        └── 498741: glPopGroupMarkerEXT()
The following shows information copied from the GPU State pane, corresponding to figure 8. Note that 24 through Label were selected in the pane, and the GPU Debugger adds the hierarchy.
state
└── Contexts
    └── 3454286112
        └── Instances
            └── Buffers
                └── 24
                    ├── Data        uint8[183024] (Pool: 0x41)
                    ├── MapData     uint8[0]
                    ├── Size        183024
                    ├── Usage       GL_STATIC_DRAW
                    ├── AccessFlags GL_PERFQUERY_SINGLE_CONTEXT_INTEL
                    ├── Mapped      GL_FALSE
                    ├── MapPointer
                    ├── MapOffset   0
                    ├── MapLength   0
                    └── Label
Here are memory values copied from the Memory pane, corresponding to figure 9:
82.58558 -33.99359 24.625002
The following GPU Debugger walkthrough demonstrates how you could approach a common issue: the result of a draw call isn't what you expected.
Here are some items you can check to hone in on the problem:
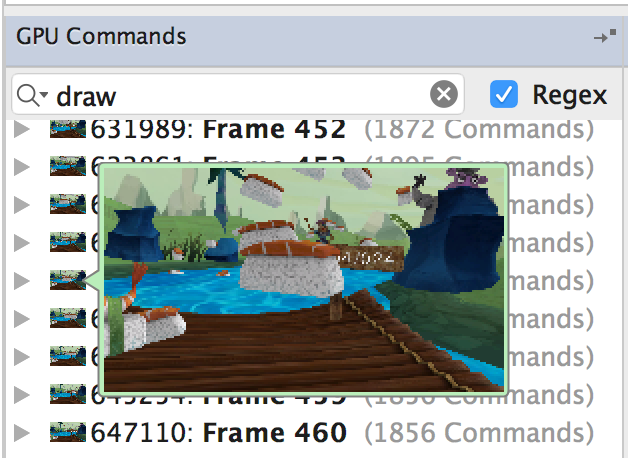 Figure 11. Examining the call thumbnails.
Select the frame you're investigating. In the GPU Commands pane, scan the thumbnail images to the left of each draw call. Hover your cursor over a thumbnail to see a larger image. The thumbnails show the result of each draw call and help you find the draw call where an unexpected result appears.
If needed, add debug markers to your application to produce an easily navigable call hierarchy.
If you see that the draw call renders properly in the middle of the frame, but it's hidden by the end of the frame, then it's likely that the draw call becomes obscured or is cleared. Scan forward through the frame to see if you can identify the location where this happens.
After you find a troublesome draw call, select it in the GPU Debugger pane and then select the Framebuffer tab. The framebuffer content appears in the Framebuffer pane.
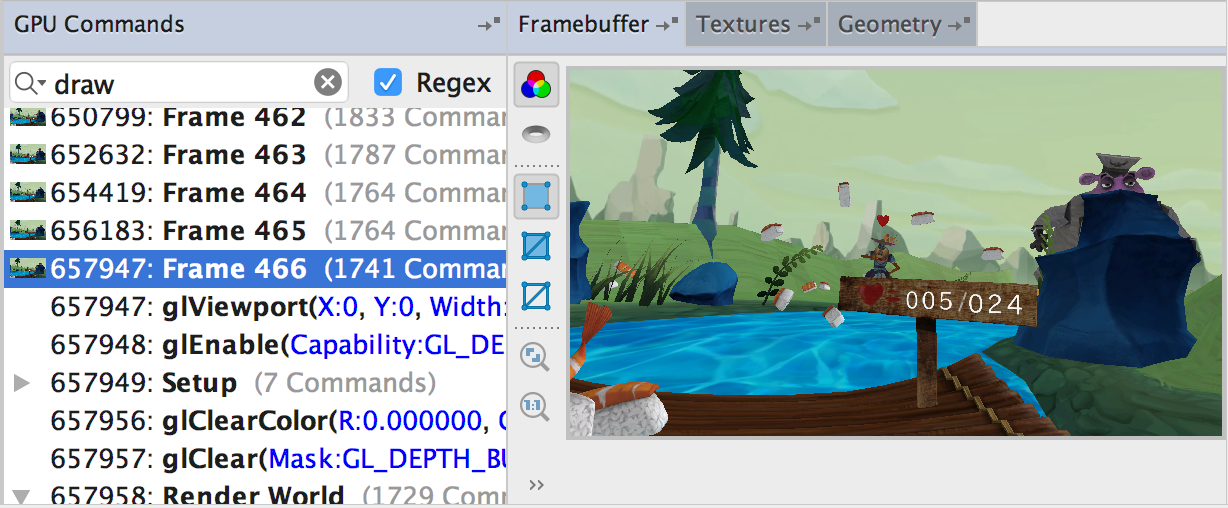
Figure 12. Looking at the framebuffer of the draw call.
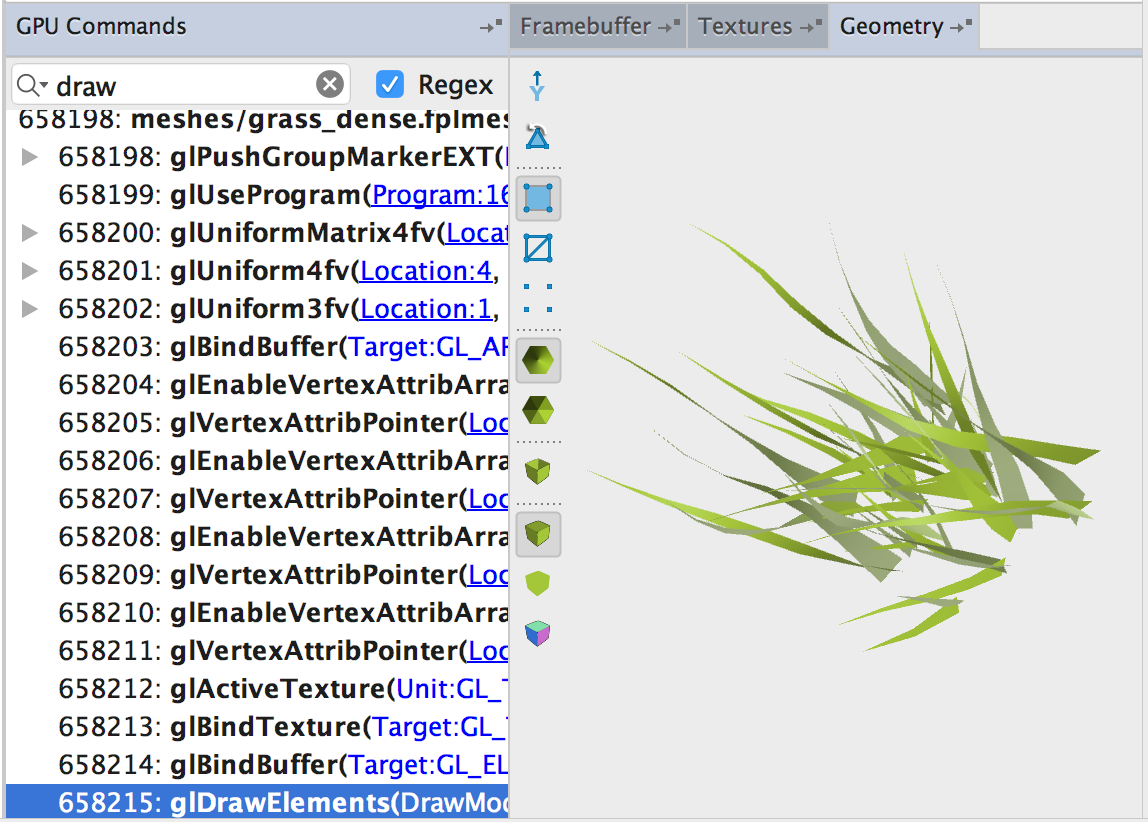
Figure 13. Examining the geometry rendering.
A draw call can affect the color, depth, and stencil buffers. Depending on the current state, the draw call can write to some or all of these buffers. Check the color buffer and depth buffers to see if you can find your draw call being rendered:
. Can you see the draw call in the color buffer?
. Can you see the silhouette of the draw
call in the depth buffer? Select the Geometry tab. In the Geometry pane, see if you recognize the geometry. If you can find the geometry but can't see it in the framebuffer, it could mean that the draw call is offscreen or the vertex shader is broken, for example.
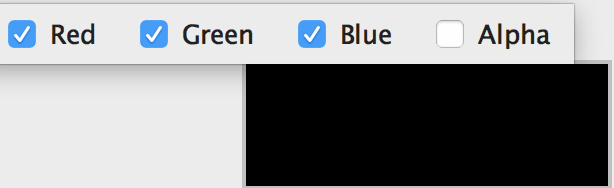
If you still can't find the issue, maybe the draw call is executed with zero alpha. In the Framebuffer pane, click Color Channels and then deselect Alpha to see if the alpha
channel is the issue.
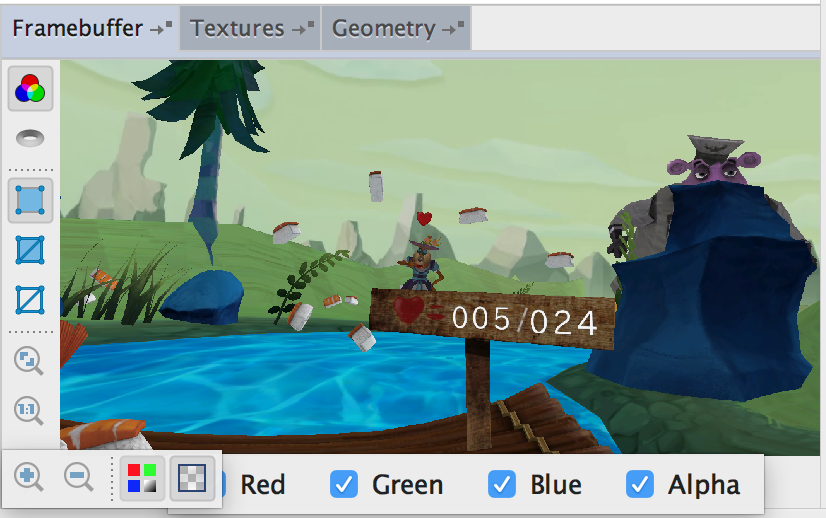
Figure 14. Turning off the alpha channel.
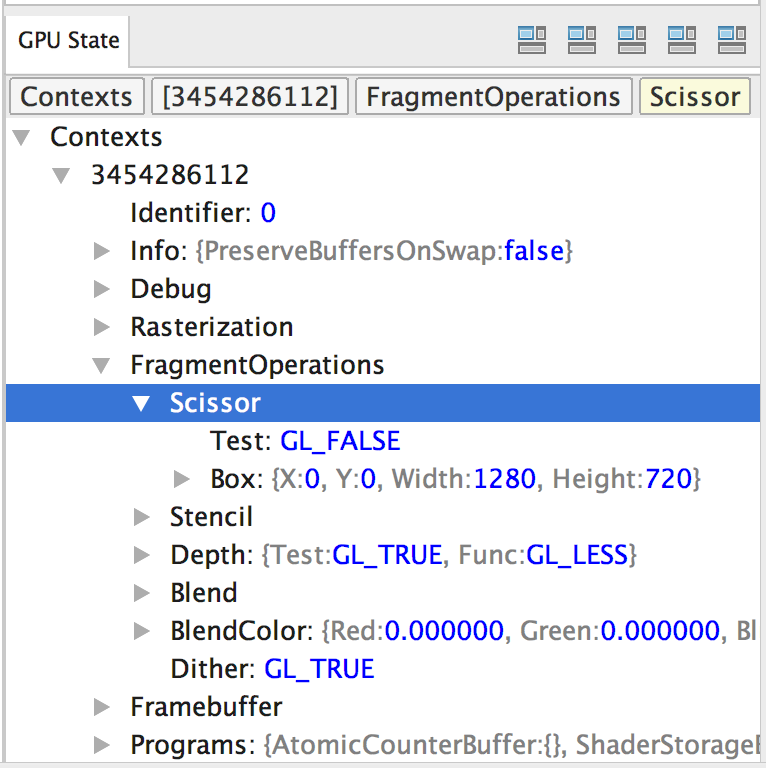
Figure 15. Investigating the state variables.
With the draw call selected in the GPU Commands pane, click the GPU State tab. In the GPU State pane, check the following OpenGL ES state variables, which can dramatically affect rendering:
glBlendFunc()
and glBlendEquation()
functions.
glScissor()
function.
glStencilOp()
function.
glDepthMask()
and glDepthFunc()
functions.
glColorMask()
function.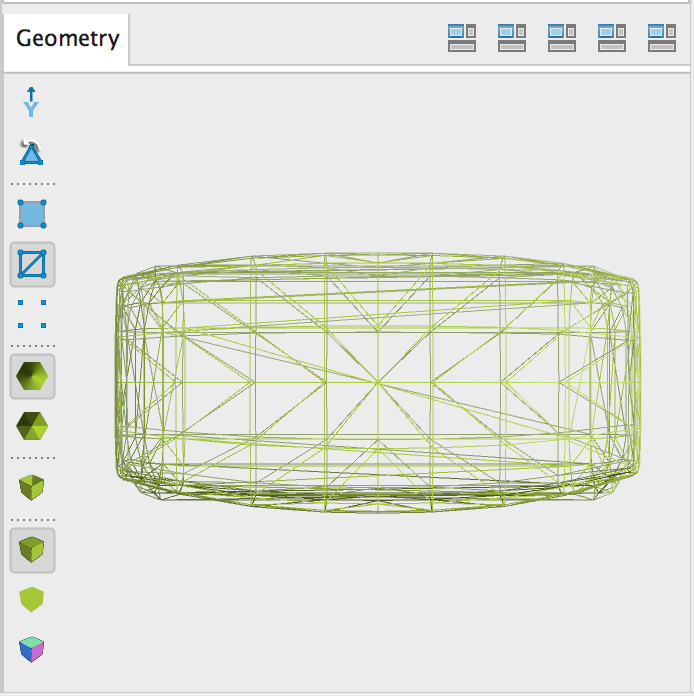
Figure 16. Looking at the mesh connectivity.
A bad mesh can have a variety of symptoms, such as stray triangles, incorrect lighting due to poor surface normals, or a "polygon soup," an unordered collection of triangles. You can use the Geometry pane to check the polygon mesh of the draw call before it's transformed by the vertex shader.
Select the draw call in the GPU Commands pane, select the Geometry tab, and then do the following in the Geometry pane:
. Does the connectivity of the mesh look correct?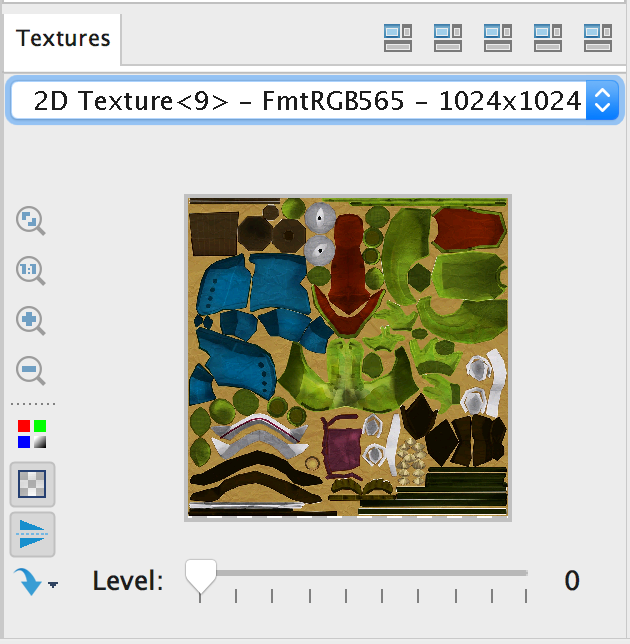
Figure 17. Examining textures.
If the mesh looks as expected but the draw call does not appear to be correct, then there may be an issue with one of the source textures. Select the draw call in the GPU Commands pane, select the Textures tab, and then select the texture from the menu. In the Textures pane, use the buttons to investigate the texture.
With the draw call selected in the GPU Commands pane, click the GPU State tab. Check the following OpenGL ES state variable: Contexts > n > Enabled.
If it's true, then alpha blending is enabled. This is controlled by a
GL_BLEND value for the glEnable()
and glDisable()
functions.
To compose the output of the fragment shader into the framebuffer, alpha blending also uses other values in Contexts > n > FragmentOperations > Blend.
For more information about how blending works, see the glBlendFunc()
function.
With the draw call selected in the GPU Commands pane, click the GPU State tab. Check the following OpenGL ES state variable: Contexts > n > FragmentOperations > Depth > Test.
If it's true, then depth testing is enabled. This is controlled by a
GL_DEPTH_TEST value for the glEnable()
and glDisable()
functions.
Depth testing determines whether to draw a fragment based on the fragment depth
and the existing depth value in the framebuffer. For more information about how
depth testing works, see the glDepthFunc()
function.